A histogram can look intimidating when you first see one, but it is actually just a simple graph showing how bright or dark the tones are in your photograph.
Once you understand what the graph is telling you, it becomes one of the most useful tools on your camera for checking exposure.
What is a photography histogram?
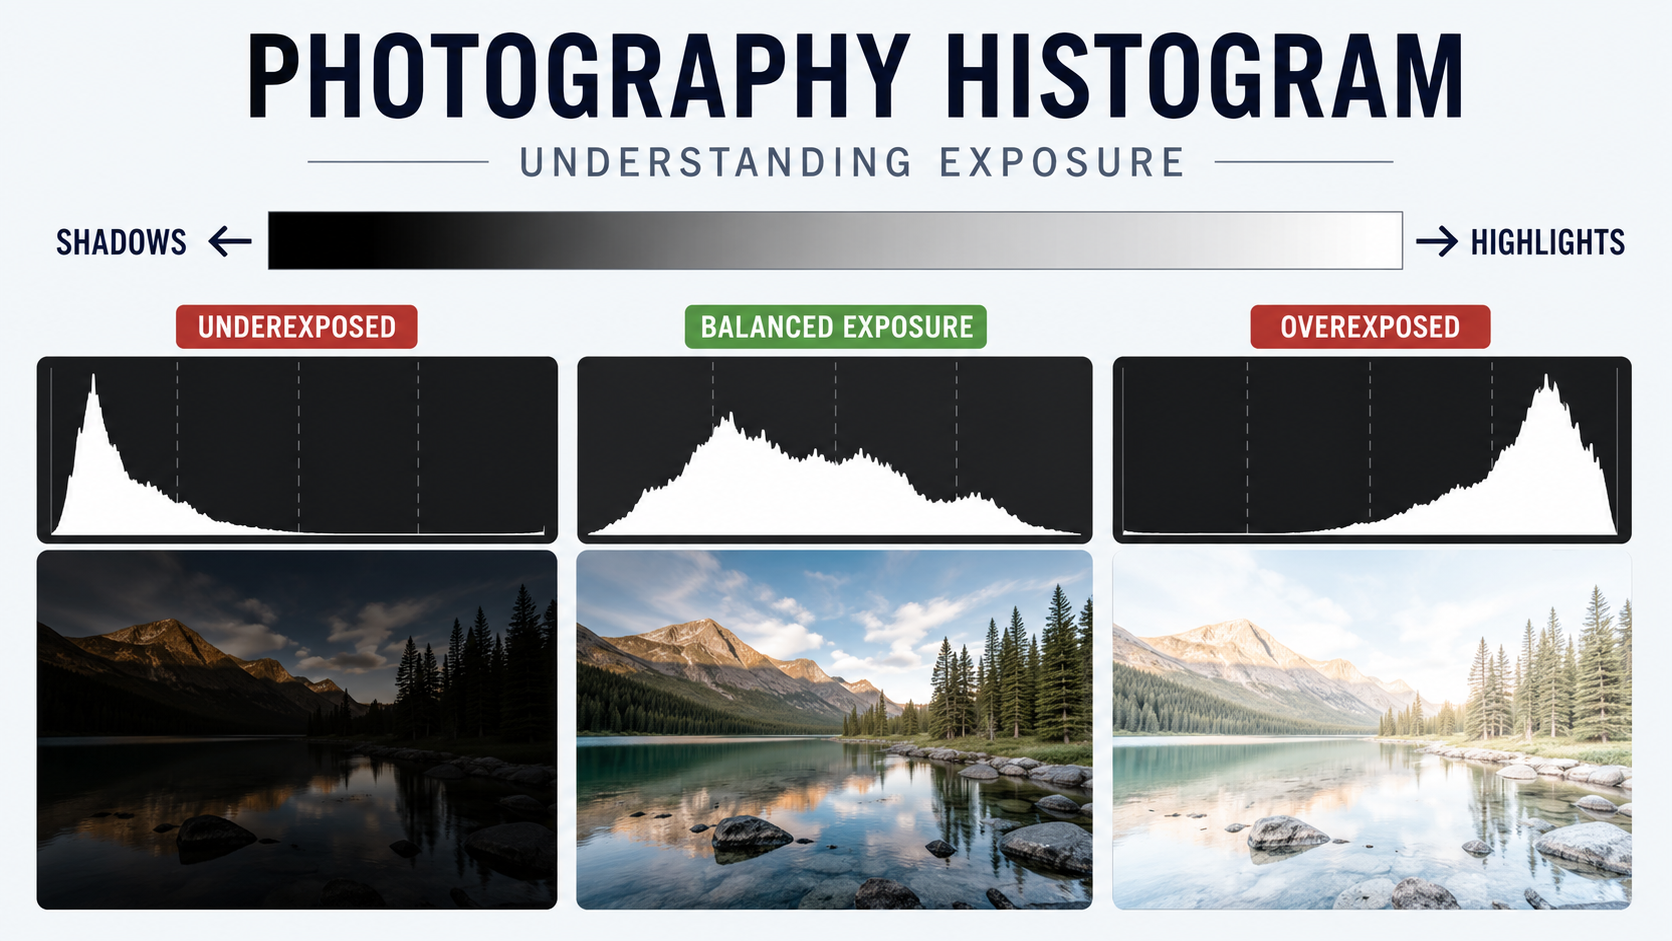
A histogram is a graph showing how the tones in your image are distributed from dark to bright.
The horizontal axis represents brightness:
- far left: black;
- left: shadows;
- middle: midtones;
- right: highlights;
- far right: white.
The vertical height of the graph tells you how many pixels are at each brightness level.
A tall spike does not automatically mean something is wrong. It just means a lot of the photograph contains tones of that brightness.
How to read a histogram
Think of the histogram as a brightness map.
If most of the graph is towards the left, the photograph contains lots of dark tones.
If most of the graph is towards the right, the photograph contains lots of bright tones.
If the graph spreads across the whole range, the image contains a mixture of shadows, midtones and highlights.
What does the left side of the histogram mean?
The left side represents the darkest parts of the image.
This includes:
- deep shadows;
- black clothing;
- dark backgrounds;
- night skies;
- underexposed areas.
If the graph is heavily concentrated on the left, the photograph may be dark - but that does not automatically mean it is underexposed.
What does the right side of the histogram mean?
The right side represents the brightest parts of the image.
This includes:
- bright skies;
- white clothing;
- snow;
- reflections;
- bright highlights.
A graph that sits mostly towards the right may be perfectly correct for a bright scene.
What are midtones?
Midtones sit around the centre of the histogram.
These are neither very dark nor very bright.
Skin tones, grass, buildings and many everyday subjects often contain a large amount of midtone information.
What is clipping?
Clipping happens when image detail is pushed beyond the brightness range the camera can record.
There are two main types:
- shadow clipping;
- highlight clipping.
Shadow clipping
Shadow clipping happens when dark areas become completely black and contain little or no recoverable detail.
On the histogram, this can appear as information pressed hard against the far left edge.
Highlight clipping
Highlight clipping happens when bright areas become completely white and important detail is lost.
On the histogram, this can appear as information pressed hard against the far right edge.
If highlight detail is important, this is something to watch carefully.
My guide to exposing for the highlights goes into this in more detail.
Is a histogram touching the edge always bad?
No.
This is one of the biggest misunderstandings beginners have about histograms.
A histogram touching the left or right edge is not automatically wrong.
Some scenes genuinely contain pure black or pure white.
The important question is: are you losing detail that matters?
Example: snow should often sit towards the right
A photograph of snow contains lots of bright tones.
Its histogram should therefore naturally sit further towards the right than a photograph of a dark interior.
Trying to force the graph into the middle could make the snow look dull and grey.
Example: night scenes should often sit towards the left
A genuine night scene contains large areas of darkness.
Its histogram will often lean strongly towards the left.
That is not necessarily underexposure. It may simply describe the scene accurately.
There is no perfect histogram shape
A good histogram does not have to look like a mountain in the middle.
Different photographs should produce different histogram shapes.
A bright beach, a dark concert stage, a studio portrait and a sunset should not all have identical histograms.
The histogram should reflect the photograph you are trying to make.
Histogram vs the camera screen
The image preview on the back of your camera is useful, but it can sometimes be misleading.
Screen brightness, ambient light and viewing angle can make an image appear brighter or darker than it really is.
The histogram gives you another way to judge the tonal distribution without relying only on how the preview looks.
This is particularly useful outdoors in bright sunlight.
Histogram and exposure compensation
The histogram becomes especially useful when combined with exposure compensation .
If the image is darker than you want, positive exposure compensation can move more information towards the right.
If the image is too bright, negative exposure compensation can move more information towards the left.
The aim is not to position the histogram in a specific place. The aim is to create the brightness and detail you want.
Histogram and metering modes
Your camera's metering mode influences the exposure decision the camera makes.
The histogram then gives you a useful way to inspect the result.
If the camera meter has produced an exposure you do not like, you can adjust the settings or use exposure compensation.
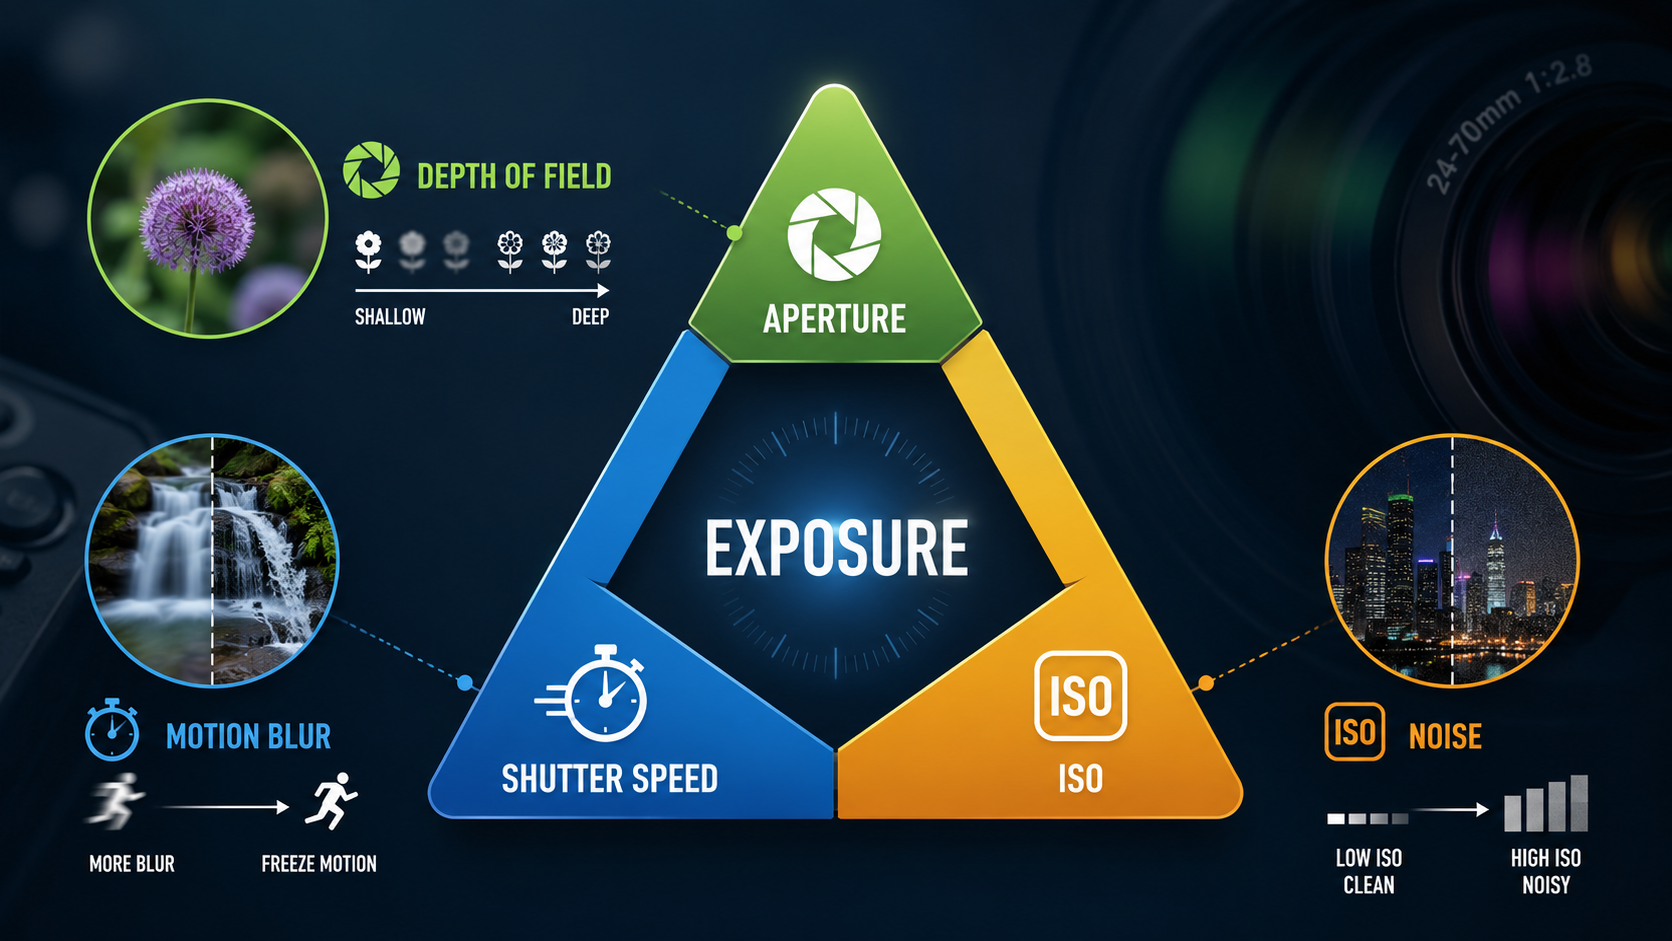
Histogram and the exposure triangle
The exposure triangle controls how the photograph is exposed.
Aperture, shutter speed and ISO influence the final image, while the histogram helps you evaluate the tonal result.
If you change one of those exposure settings and make the image brighter, the histogram will generally shift towards the right.
Make it darker and the histogram generally shifts towards the left.
Brightness histogram vs RGB histogram
Many cameras can display more than one type of histogram.
Brightness histogram
A brightness or luminance histogram gives you a general view of how light and dark the image is.
For beginners, this is usually the easiest place to start.
RGB histogram
An RGB histogram displays the red, green and blue colour channels separately.
This is useful because an individual colour channel can clip even when the overall brightness histogram does not appear to be clipped.
For example, a very bright red flower may lose detail in the red channel before the overall image appears completely overexposed.
What are highlight warnings or blinkies?
Many cameras can flash overexposed areas during image review.
Photographers often call these warnings blinkies.
They are useful because they quickly show where highlight clipping may be happening.
Like the histogram, they are a guide. A small clipped reflection or light bulb may not matter, while a clipped white wedding dress might matter a great deal.
Do you always need to avoid clipping?
No.
Some highlights are naturally too bright to contain useful detail.
Examples might include:
- the sun itself;
- specular reflections;
- street lights;
- small bright bulbs;
- reflections from polished metal.
Protect the detail that matters rather than becoming obsessed with making every pixel fit perfectly inside the histogram.
How to use the histogram in Aperture Priority
In Aperture Priority, you choose the aperture and the camera chooses the shutter speed.
Take a photograph and inspect the histogram.
If the result is too bright or too dark, use exposure compensation while keeping your chosen aperture.
This is one of the simplest ways for beginners to start using the histogram practically.
How to use the histogram in Manual mode
In Manual mode, you control aperture and shutter speed, and often ISO as well.
Take the photograph, inspect the histogram and adjust whichever setting makes most sense creatively.
For example:
- adjust shutter speed if motion control allows it;
- adjust aperture if depth of field allows it;
- adjust ISO when you need to preserve the aperture and shutter speed you have chosen.
A simple beginner histogram workflow
- Take the photograph.
- Look at the image preview.
- Check the histogram.
- Look for important shadows or highlights being pushed against the edges.
- Decide whether those areas should contain detail.
- Adjust exposure or exposure compensation if necessary.
- Take another photograph.
- Compare the result.
Beginner mistakes with histograms
Trying to centre every histogram
Different scenes naturally produce different distributions of brightness.
Thinking every edge touch is clipping
Pure black and pure white can legitimately exist in a photograph.
Ignoring the subject
The histogram describes the whole image, but the important subject may occupy only a small part of the frame.
Watching the graph instead of making photographs
The histogram is a tool, not the objective.
Use it when it helps you make better exposure decisions, then get back to photographing.
Photography histogram - key points
- Left means dark.
- Right means bright.
- The middle contains midtones.
- The graph height shows how many pixels have that brightness.
- A histogram does not need to be centred.
- Touching an edge is not automatically wrong.
- Clipping matters when important detail is being lost.
- Bright scenes naturally lean right and dark scenes naturally lean left.
- Use the histogram alongside the image preview, not instead of thinking about the photograph.
Want to stop guessing at exposure?
My beginner photography courses teach aperture, shutter speed, ISO, camera modes, metering, exposure compensation and histogram reading step by step. You can learn online or through practical one-to-one tuition around Portsmouth.
Explore beginner photography coursesContinue learning exposure
Exposure Triangle
Read GuideMetering Modes
Read GuideExposure Compensation
Read GuideExpose for Highlights
Read Guide
Andy Hornby
Photographer, educator and workshop leader with more than twenty-five years of practical photography experience.
Learn with Andy